2015 Trucking Perspectives

Inbound Logistics’ exclusive trucking market research report delivers shipper and motor carrier insights into trucking challenges and trends.
Capacity has become an inexorable focal point in the U.S. transportation and logistics sector over the past several years. Carriers and asset-based service providers alike have long proselytized the inevitable Armageddon likely to strike as freight volumes rebound and baby boomer drivers retire. Shippers have alternated between cynicism and belief. It’s the yet-to-happen reality that consumes the here and now.
Riding Shotgun
Trucking Perspectives Methodology
Trucking companies responding to Inbound Logistics‘ 2015 Trucking Perspectives survey by and large see an economy on the make—54 percent expect static growth in the near term, while 40 percent see the economy trending upward. Only six percent forecast conditions getting worse.
Relative optimism aside, carriers are notably less positive about conditions than they were in 2014, when close to 75 percent indicated growth was trending upward. Many concerns on the global front—notably China’s sputtering economy and currency devaluation—could impact U.S. exports and domestic job growth. Global stock market volatility has been sharp. U.S. consumer sentiment dropped to a one-year low in September 2015.
On the domestic front, capacity worries remain an important undercurrent in the transportation space. In some lanes, and for certain types of equipment, the market is already tightening. But a precipitous drop in oil prices, largely driven by a glut of North American production, provided shippers and carriers with a reprieve in 2015.
Shippers that migrated to more economical rail/intermodal services have been lured back by cheaper and faster over-the-road options. The market demands it. The continuing evolution of e-commerce and omni-channel management places a premium on speed. Carriers have been able to reallocate fuel cost savings to help recruit drivers with more lucrative enticements.
The U.S. trucking market is a dynamic force. Shipper proclivities year to year reflect the volatility of supply and demand, and offer a good indication of where the economy is trending. 2015 has been no less intriguing.
Assets or Not?
XPO Logistics’ recent $3-billion acquisition of Con-way offers a pretty good idea of how industry appreciates capacity. The third-party logistics (3PL) provider has long maintained an asset-light profile. But its decision to buy the second-largest U.S. less-than-truckload (LTL) carrier was predicated on listening to customer demand. “If you don’t have assets, you’re not sitting at the adult table,” said XPO Logistics Chairman and CEO Brad Jacobs on a recent investor’s call announcing the acquisition.
Shippers value carriers that have dedicated capacity. As the market tightens, it will become an invaluable asset.
In 2015, carriers on average report fleets with 3,352 units, up from 3,268 last year. Just five years ago, the average was 2,542 units. In terms of equipment, trucking companies own 7,536 trailers—compared to 7,252 in 2014. Attrition and consolidation continue to shape the truck fleet.
Driver availability remains the topic du jour. Many carriers are stepping up recruitment efforts to attract new talent. Some are leveraging the drop in fuel prices to help subsidize higher pay.
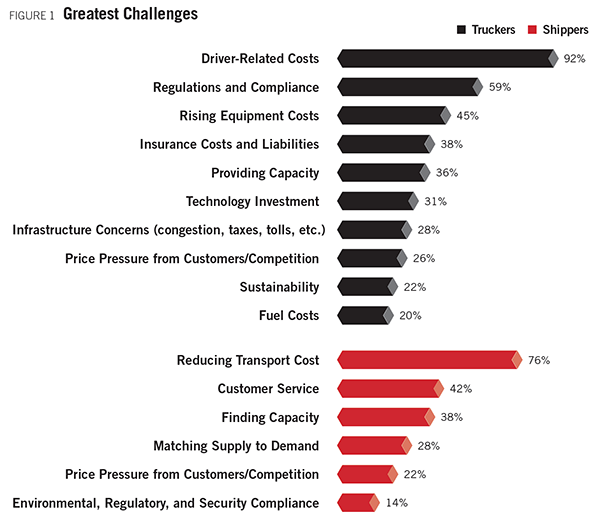
Trucking companies report on average 3,011 drivers (owner operators included) compared to 2,867 drivers in 2014. Coming out of the recession in 2011, headcount was 2,507. Carriers are sensitive to demographic shifts and how labor recruitment, retention, and training impact their business. Turnover is a huge cost. Estimates peg the price of recruiting and training one new driver at $5,000. As expected, 92 percent of truckers polled in this year’s Trucking Perspectives identify driver-related costs as their greatest challenge—compared to 89 percent in 2014 (see Figure 1).
Carrier outlay inevitably bleeds to the shipper, and ultimately to the end consumer. That’s why reducing transport costs remains the top concern among freight buyers, according to 76 percent of survey respondents—followed by customer service (42 percent) and finding capacity (38 percent). It’s worth noting that shipper sentiment toward cost reduction and customer service in 2014 was considerably more balanced—46 percent to 44 percent.
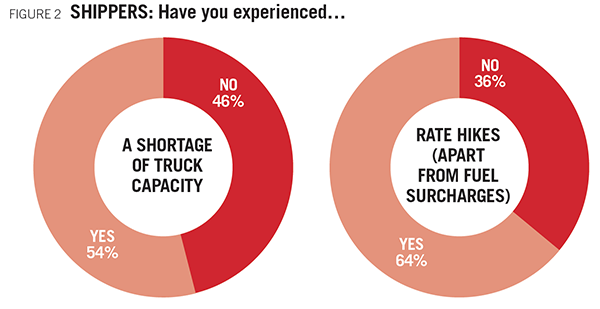
Why the change? For one, only 54 percent of shippers in 2015 report experiencing a shortage of capacity, compared to 78 percent in 2014 (see Figure 2). By the same token, 89 percent experienced rate hikes apart from fuel surcharges in 2014. This year, only 64 percent of freight buyers responded in kind.
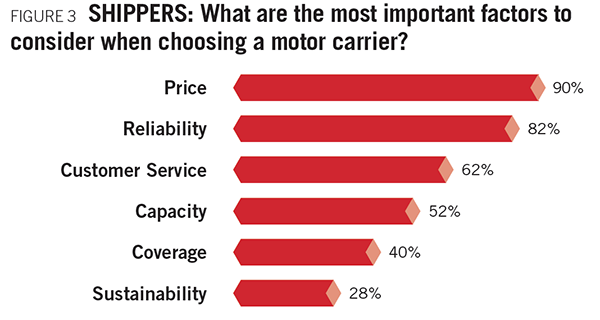
Even more telling, 90 percent of shippers cite price as the most important factor to consider when vetting truck partners (see Figure 3), followed by reliability (82 percent), customer service (62 percent), and capacity (52 percent). This represents a significant shift from 2014, when reliability topped the list, followed by pricing.
Clearly, shippers still believe they have leverage in the market to negotiate with carriers. It remains to be seen how long that will last.
Technology is another important facilitator. To point, 31 percent of truckers identify IT investment as a challenge. Carriers need to acquire the appropriate transportation management, dispatch, and optimization systems to improve yields and increase efficiency. This includes equipment as well. Trailer skirts and tails that advance fuel economy are growing increasingly popular.
From a network perspective, a lot of latent capacity in the market goes unused—whether it’s within urban courier networks or private fleets. A number of different IT vendors provide platforms that give users visibility into capacity. This way they can better utilize assets, build more continuous moves, and ultimately reduce deadheads. Elsewhere, the idea of crowdsourcing unused space using Uber-type technology continues to gain traction.
While labor remains a constraint, technology and innovation may soon provide yet another alternative. Truck manufacturers are toying with self-driving prototypes. Germany-based Daimler, for example, has been piloting autonomous rigs in Nevada during the past year. Mainstream deployment in Europe could happen by 2020.
Regulation Consternation
Legislators have proposed another solution to ease the truck driver crisis, eliciting mixed reaction from public and private stakeholders. The latest highway bill circulating Congress includes a provision that would lower the minimum truck-driving age to 18 for interstate commerce. Currently, teenagers can only operate rigs within a state’s borders.
It’s a divisive issue that will likely be jettisoned in favor of compromise, but it presents a realistic alternative.
For many in the trucking industry, however, government regulation is a bane. Freight carriers and buyers have long suffered from overbearing and onerous legislation that impedes productivity and increases costs. Apart from driver recruitment and related costs, 59 percent of trucking respondents cite an oppressive regulatory environment as their second-greatest challenge.
While the public sector widely supports efforts to improve safety and security on U.S. highways and byways, it has done little to improve the crumbling infrastructure necessary to support interstate and global commerce. It’s worth reiterating that Congress has passed 33 extensions over the past six years to keep the Highway Trust Fund solvent. It’s an inconvenient, and ironic, contrast.
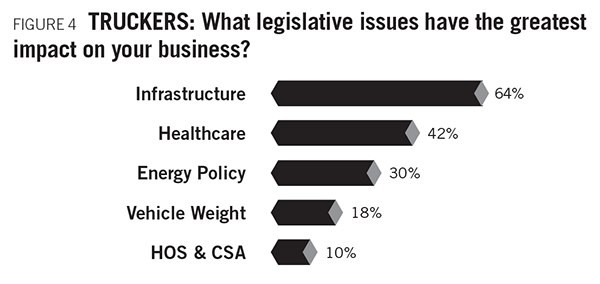
Infrastructure remains the most impactful legislative issue on the docket, according to 64 percent of truckers. Healthcare (42 percent), energy policy (30 percent), vehicle weight (18 percent), and Hours-of-Service/Compliance, Safety, Accountability (10 percent) round out the list (see Figure 4).
The debate over increasing gross vehicle weights has become a flashpoint in the transportation industry. Railroads have sided with public safety advocates who oppose any change to the existing 80,000-pound limit for interstate commerce. Given the downward fuel price trend, trucking has become a more competitive option. The railroads view any increase in tonnage as a competitive disadvantage.
Meanwhile, motor freight carriers and shippers are still coming to terms with the Federal Motor Carrier Safety Administration’s (FMCSA) Hours-of-Service (HOS) and Compliance, Safety, Accountability (CSA) mandates—both of which have increased costs. Industry appears to be more receptive and/or less reactive to regulations that improve safety and quality. For example, 50 percent of shippers have not experienced a noticeable cost or service impact on operations because of CSA scorecarding—25 percent have. That said, freight buyers are largely insulated because the burden of responsibility ultimately falls on carriers and brokers.
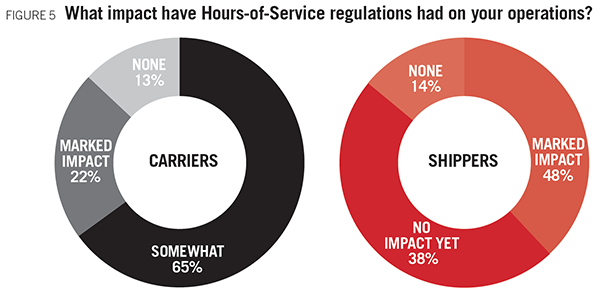
HOS, on the other hand, remains a third-rail topic for the trucking industry. In 2015, 87 percent of trucking respondents report that the HOS rules have had an impact on their operations—while 22 percent cite a “marked impact” (see Figure 5). This follows 2014 data. Shipper reactions remain mixed—48 percent acknowledge that HOS has had a “marked impact,” while 14 percent have seen no impact whatsoever. The remaining 38 percent expect to eventually see one.
Government’s decision to roll back two important provisions in the new rules—that a driver’s 34-hour restart include two 1 a.m. to 5 a.m. periods, and the limitation of the restart’s use to once per week—was widely applauded. FMCSA will need to conduct further study before a final decision is ultimately made regarding enforcement.
The electronic on-board recorder (EOBR) mandate, which is part of the HOS guidelines, has been well received by the trucking industry. Many carriers see the requirements as inevitable—while also recognizing the value of automating driver data collection. Eighty-seven percent of surveyed truckers have already equipped their fleets with EOBRs.
Brokering Change
On the brokerage side, change is rampant. UPS’ acquisition of Coyote Logistics and the XPO-Con-way merger reflect ongoing contraction within the industry. Freight brokerage is a lucrative business in good times and bad. When capacity is tight, service providers help shippers find space and empower carriers to seek more backhaul opportunities. In a soft market, brokers help carriers find loads and provide freight buyers with leverage to cost compare different lanes. Venture capital is taking notice. Investors see opportunities to further consolidate a very fragmented space.
The growth of megabrokers will invariably have an impact on shippers as they control more of the market, including pricing. As intermediaries become more technologically savvy, and develop value-added capabilities beyond transactional, the value proposition only grows. More shippers, especially small and mid-sized companies, will likely seek their services.
An interesting dichotomy still exists between brokers and carriers, and how shippers align with both. XPO’s Con-way acquisition, which was driven by customer demand, reveals how important dedicated capacity is in the minds of shippers—especially as the market tightens.
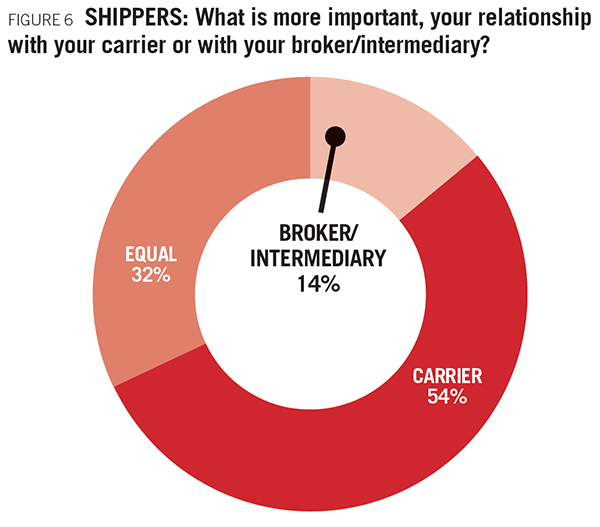
Fifty-four percent of surveyed shippers say they value carrier partners more than brokers—compared to 56 percent last year (see Figure 6). In 2012, only 38 percent acknowledged as much, which may offer a clue as to where shippers see the capacity pendulum swinging. By comparison, only 14 percent prefer brokers exclusively; and 32 percent hold both brokers and carriers in similar esteem.
Invariably, shippers will likely have to lean on both carrier partners and brokers, and benchmark off both, as they evaluate their transportation needs moving forward.
2015 Top 100 Truckers
As always, Inbound Logistics‘ annual Top 100 Truckers directory brings Trucking Perspectives full circle with an in-depth index of carriers that match the diverse needs of the shipping community.
IL editors selected this year’s list from a pool of 200-plus trucking companies, evaluating surveys, conducting online research, and talking with truckers and shippers alike. This guide serves as a benchmark for the types of services transportation buyers value when looking for new partners or evaluating current ones.
The Top 100 list offers a snapshot of the trucking segment, including large truckload and LTL carriers with global inroads and niche-specific regional haulers that get their white gloves dirty delivering to the final mile.
Together, Trucking Perspectives and the Top 100 Truckers directory provide a comprehensive guide to help you find partners that will put your company in the driver’s seat.
Riding Shotgun
The U.S. trucking industry provides an array of services, from mud-flapping nationwide truckload shipments to white-glove, last-mile delivery—and everything in between. Here’s an overview of carrier services, geographic scope, and assets based on Trucking Perspectives survey responses.
| Capacity | |
| Average Fleet Size (tractors and vans) | 3,352 units |
| Average Trailer Fleet | 7,536 units |
| Average Number of Drivers (owner operators included) | 3,011 |
| Operating Area | |
| North America | 64% |
| U.S. Only | 36% |
| Global | 29% |
| Trucking Services | |
| Truckload | 85% |
| Logistics Services | 69% |
| Expedited | 62% |
| Dedicated Contract Carriage | 61% |
| Less-than-Truckload | 55% |
| Intermodal | 52% |
| Refrigerated | 44% |
| Flatbed | 44% |
| Bulk | 35% |
| Final Mile | 30% |
| White Glove | 27% |
| Household Goods | 26% |
| Motor Vehicle Carrier | 16% |
| Tank Car | 16% |
| Package | 4% |
| Certifications | |
| SmartWay | 94% |
| HazMat | 78% |
| C-TPAT | 62% |
| Free And Secure Trade (FAST) | 41% |
| Partners In Protection (PIP) | 29% |
| ISO | 27% |
| ACC Responsible Care | 16% |
| Vertical Specialty | |
| Food & Beverage | 82% |
| Retail | 81% |
| Freight All Kinds | 79% |
| Automotive | 79% |
| Construction & Building Materials | 78% |
| Valuables (electronics, pharma, jewelry) | 64% |
| Chemicals | 60% |
| Agriculture | 57% |
| Furniture | 54% |
| Oil & Gas | 22% |
Trucking Perspectives Methodology
Inbound Logistics‘ annual Trucking Perspectives market insight report includes input from both over-the-road carriers and shippers to provide a comparative analysis supported by empirical data and anecdotal observations. Our outreach comprises two parts.
First, IL solicited more than 200 trucking companies to complete a questionnaire that documents their assets, service capabilities, operational scope, and areas of expertise. We also asked carriers to comment on challenges and opportunities in today’s market.
Secondly, Inbound Logistics reached out to more than 100 unique freight shippers to comment on industry trends, regulatory challenges, and their partnerships with carriers.

