Q4 Logistics Predictions; The Lowdown on Parcel Spend; Rural America’s Manufacturing Moment & Other Supply Chain News

Logistics and supply chain news and insights shaping the future of global logistics.
Q4 Logistics Vibes: “Wait and See”
BlueGrace Logistics’ latest Logistics Confidence Index report—based on a quarterly survey of North American shippers across LTL and FTL modes—paints a nuanced picture of freight-sector sentiment as we move into Q4 2025. While confidence in revenue retreats, companies remain cautious around inventory positioning and order volume stability. Taken together, the trends suggest mild pessimism underpinned by a strategy-focused approach to operational resilience, notes the Index.
“With looming interest rate drops that have yet to come to fruition and continuing volatility in trade agreements and tariff implications, it seems ‘wait and see’ continues to be the theme for 2025,” explains BlueGrace’s Jason Lockard, senior vice president of managed logistics.
What to expect in Q4, according to the Confidence Index:
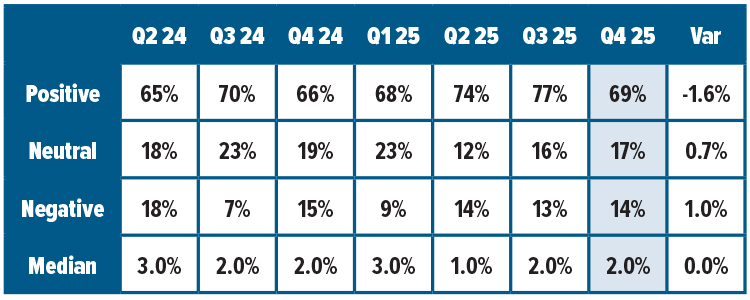
Revenue expectations take a dip. (See chart below)
- 69% of shippers forecast positive revenue growth in Q4 2025, an almost 10-point drop from 77% in Q3, though up slightly from one year ago.
- Neutral sentiment dropped to 17% (from 23% in Q4 2024), while negative sentiment hit 14%, in line with earlier 2025 expectations.
Inventory outlook stabilizes—with cautious restraint.
- Inventory expectations saw a notable shift for Q4, with a 14.8-point decline in positive responses offset by a 14.6-point rise in neutral sentiment quarter-over-quarter.
Order-growth sentiment shifts to neutral.
- A majority (60%) of shippers shifted into the “neutral” category, marking the second-highest level of neutral sentiment since Q4 2023. The mean growth expectation declined from 1.7% to 1.2%, while the median fell to 0%, down from 1% last quarter.
What is your expected revenue growth for the next quarter?
Parsing Out Parcel Spend
Amid rising parcel volumes and increasingly ambiguous carrier pricing, Reveel’s inaugural Parcel Shipping Intelligence Market Survey uncovers a gap in how organizations understand and manage parcel spend. The survey of more than 150 North American supply chain and logistics leaders paints a clear picture: parcel shipping has become more complex and cost‑intensive, yet most shippers lack the insights needed to control it effectively.
Most respondents predict their shipping volumes will increase or stay the same this year, but almost half (44%) report a lack of information about shipping expenses and what could help them improve. This points to growing frustration with carriers, as an overwhelming number of respondents (91%) plan to expand the number of carriers they utilize in order to mitigate rising and unpredictable parcel shipping fees.
Other important takeaways include:
- 87% of respondents expect their parcel shipping volumes to increase this year, while no organization anticipates a decline.
- 44% report insufficient information on overall shipping costs.
- 59% lack insight into demand forecasting, while 57% lack visibility into vendor (carrier) performance, and 50% lack clarity on inventory levels.
- Respondents believe optimizing packaging (60%) and leveraging automation (48%) offer the strongest path toward reducing parcel shipping expenses. (See chart below.)
The report also indicates that parcel spend can consume a considerable amount of an organization’s budget—currently, logistics expenses average 22% of organizations’ overall operating expenses. Respondents report that, within their overall logistics budgets, parcel shipping costs break down as follows:
- 37% allocate between $2 million and $10 million
- 42% allocate between $10 million and $50 million
- 21% allocate more than $50 million
What Works: Most Effective Strategies to Reduce Shipping Costs
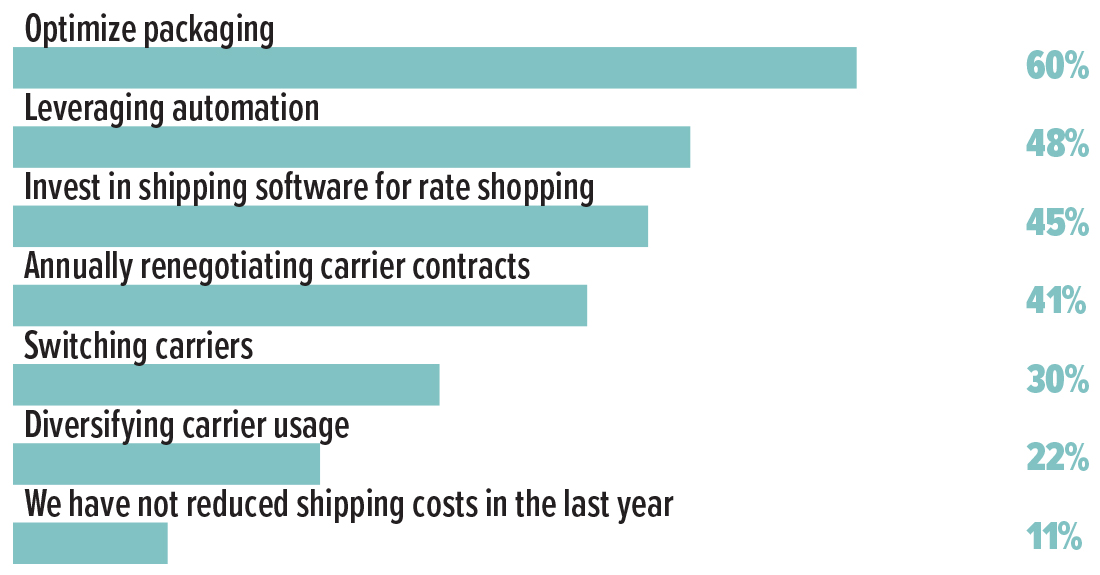
Source: Reveel
Summer Shipping Faced Headwinds
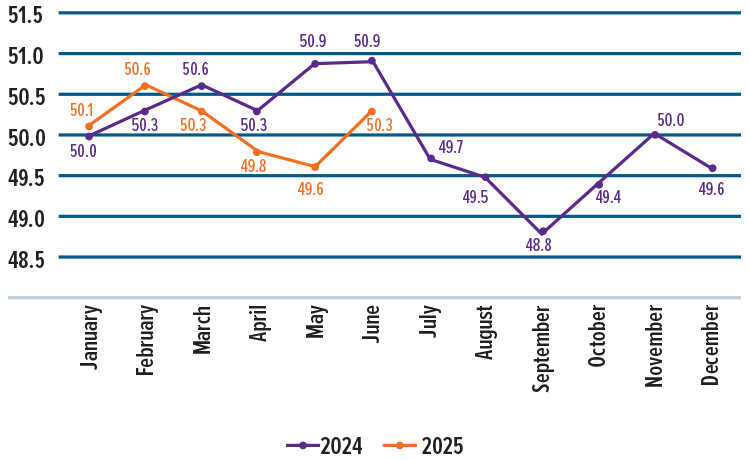
Global Manufacturing PMI
2024 vs 2025
Though the number of “out-of-office” email responses ticked up throughout the summer as vacations proliferated, the global supply chain was still hard at work. Current economic indicators, as reported in Dimerco’s August Asia Pacific Freight Report—based on data through June 2025—illustrate how tariffs, inflation, and other geopolitical events played out across logistics networks over the summer season:
Manufacturing rebounds slightly, but uncertainty lingers. Global manufacturing picked up slightly in June, with production rising at the fastest pace in three months. The Global Manufacturing Purchasing Managers’ Index (PMI) hit 50.3 in June, compared with a PMI of 49.6 in May. (See graph, above.) This was mainly due to U.S. companies rushing orders before the new tariffs took effect on July 9. However, overall growth is still slower than before the pandemic, and businesses remain cautious because of ongoing trade tensions and global uncertainties, finds the report.
U.S. retail sales slip as consumers turn cautious. U.S. retail sales fell in June for the first time since February, with most categories down except digital products—hinting that shoppers are cautious amid tariff concerns and unclear policies. Many companies have already frontloaded inventories, which may dampen export demand. While the economy stays stable, trade uncertainty continues to affect consumer behavior and global shipping for the rest of 2025.
Other logistics “wild cards” noted in the report include the potential impact on air freight stability from summer monsoon season in much of Asia; predicted ongoing ocean freight disruption due to tariff unpredictability; and the possibility that Middle East tensions will reignite problematic sailings in the Red Sea.
Rural America’s Manufacturing Moment
A new McKinsey Institute for Economic Mobility report forecasts a transformative decade for rural America, with $1 trillion in announced advanced manufacturing investments—63% of it within commuting distance of rural communities. Driven by reshoring, supply chain resilience, and technological change, this wave of capital is poised to create high-quality jobs and inject an estimated $34 billion annually into rural wages.
For supply chain and manufacturing leaders, the opportunity is clear but conditional: by 2030, the United States could face a 2.1 million worker shortfall in manufacturing, including a 58% gap in semiconductor roles. Rural K-12 schools—particularly in what McKinsey deems “manufacturing workshop” and “middle America” archetypes—will be essential partners in building the talent pipeline.
Stronger school-industry collaboration could deliver $20 billion annually in productivity and retention gains, the report estimates. Strategies include expanding career and technical education, dual-enrollment, youth apprenticeships, and industry-driven career academies.
Existing programs have shown that early, sustained engagement with students—aligned to local industry needs—can produce credentialed, job-ready graduates.
The report urges executives to move beyond sporadic outreach toward sustained, multi-year engagement through actions including:
- Helping schools deliver core literacy, math, and critical thinking skills.
- Co-designing STEM and technical curricula.
- Creating work-based learning opportunities.
Notably, eight in 10 rural students want such career-connected learning, but fewer than half report access. McKinsey’s key takeaway? Companies that act now to integrate workforce development into their expansion plans stand to secure a competitive talent advantage, reduce attrition, and deepen their community impact.
Nearly two-thirds of the $1 trillion in announced advanced-manufacturing investments will support facilities within commuting distance of rural America.
Share of strategic-sector manufacturing investment* announcements by geography, 2021-24, % of total
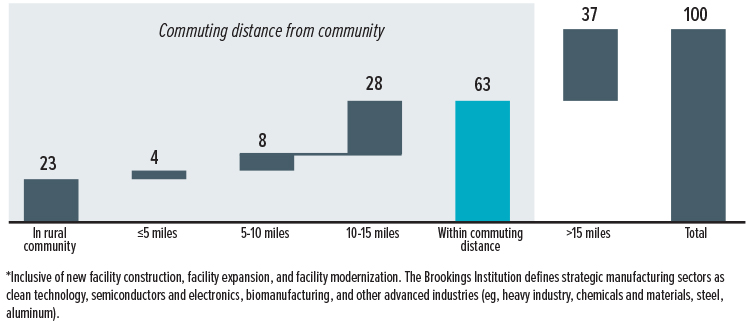
Source: AAA Foundation; Brookings Institution; US Census Bureau; White House; McKinsey analysis