Trends—July 2016

2016: Logistics in Transition
It’s transition time for the supply chain and logistics sector. New technologies are on the horizon, but aren’t here yet. Old ways of doing things are being slowly phased out as new ways phase in. Decades-old trade barriers are breaking down, opening new markets to the world. The way consumers shop is in flux, and their shipping expectations are becoming more expensive for carriers. Greener energies are incrementally replacing coal. In a few short years, we’ve gone from oil shortages to a global market saturated in oil.
With so much up in the air, it’s hard for companies to know how to proceed. But to look forward, we have to sometimes look behind us. That’s why the Council of Supply Chain Management Professionals (CSCMP) and Penske Logistics annually examine the trends of the year behind us to help determine where we should go in the years ahead.
At the end of June 2016, CSCMP and Penske Logistics released the 27th annual State of Logistics report, titled Logistics in Transition: New Drivers at the Wheel, which addresses all of the above issues. This year’s report has a new author as well: consulting firm A.T. Kearney.
The Economy Looks Pretty Good
The global economy grew in 2015 by about 2.8 percent, and the U.S. economy was close behind at 2.4 percent, according to the International Monetary Fund (IMF). The IMF expects similar growth over the next two years.
In particular, the dollar looks better than it has in some time, rising 23 percent between July 2014 and December 2015, according to the Federal Reserve. A 3.2-percent rise in consumer spending and a stronger housing market are other notable indicators of a healthy American economy.
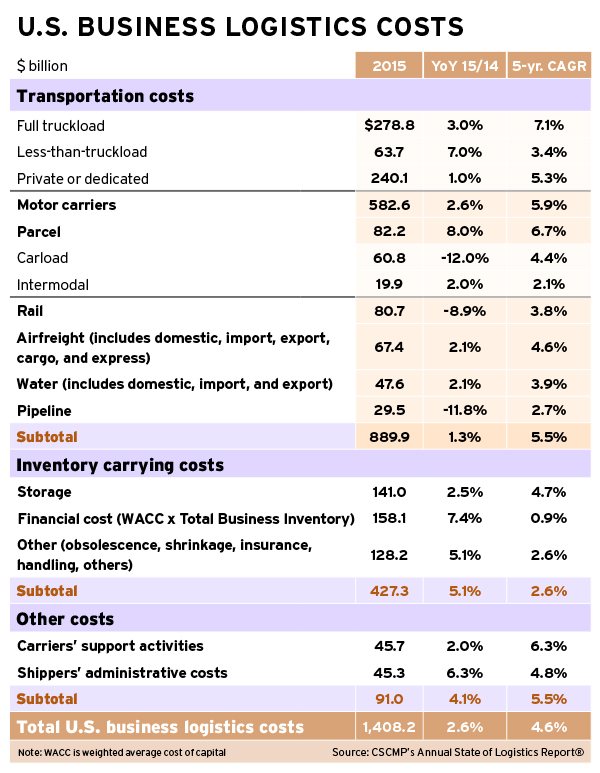
Still, things are far from perfect, and shippers need to watch some issues closely moving forward. Total business logistics costs rose 2.6 percent over 2014, to $1.48 trillion, representing a large slowdown from prior years. The strength of consumer spending would normally create higher demand for logistics services, but that hasn’t been the case either. Average inventory rose by only 0.25 percent, which some fear is an indicator of another economic crash. More likely, and supported by the positive numbers of the Cass Freight Index in early 2016, among other sources, this stat is just an indicator of a correction after inventory steadily rose by more than 5 percent between 2009 and 2014, the report says.
A risk of further labor issues also looms. The strong housing market, while mostly good for business, creates competition in the labor force. In addition, tensions still run high at West Coast ports, and another strike could have a big economic impact on the supply chain as it has in years past. More trouble at West Coast ports could also shift demand between U.S. coasts now that the expanded Panama Canal is open for business.
American Infrastructure Is Still Terrible
The Fixing America’s Surface Transportation (FAST) Act provided a big sticky Band-Aid for American infrastructure, but it won’t be enough. The FAST Act grants $305 billion to critical transportation projects through 2020, but the American Society of Civil Engineers (ASCE) estimates more than $2 trillion in repairs to surface transportation infrastructure will be necessary between now and 2025, according to CSCMP’s report.
While some critical highway projects will get the money they have long needed, with 90 percent of FAST Act funds going to the Federal Highway Administration, rail, port, and intermodal projects will be left in the dust. The 10 percent allotted for these other projects won’t cover much. Unless Congress finds the money, the will, and the bipartisan support to tackle this problem, it seems likely that failing infrastructure will plague the American logistics sector for a long time to come.
Every Mode Has Its Thorn
Trucking racked up $583 billion in revenues in 2015, according to the report. On the surface, that dollar amount makes it seem like things are going pretty stellar for trucking, but that isn’t necessarily the case.
Rates finally fell in 2015 due to overcapacity issues, after several years of upward trends. They started low in January 2015 and only got progressively lower as the year went on. This stopped many carriers from buying new equipment and expanding fleet sizes.
And even if they could have expanded, there’s nobody to drive the new trucks. Tightening safety regulations mean drivers can work fewer hours and new drivers face tougher standards to get licensed. This puts even greater stress on a labor pool that’s already stretched far beyond its capacity. Trucking companies have been forced to increase wages by at least 2 percent annually, cutting into their own bottom lines, as they poach drivers from each other. But without a new influx of drivers into the labor pool, the issue will get worse before it gets better.
Rail has its own positives and negatives. Natural gas overtook coal-powered energy as the largest producer of electricity in the United States, contributing to a 14-percent decline in coal traffic by rail. An oversaturated oil market has seen less oil moving by rail as well, possibly due to increased pipeline investment in the United States.
The rail industry saw a total decline of 2.5 percent in volume in 2015. Rail has relied steadily on intermodal traffic for growth in recent years, but even that stalled out in 2015 as the trucking capacity crisis eased up and shippers moved their goods back to the highway.
Meanwhile, airfreight carriers still can’t get their overcapacity problem under control. Both passenger and cargo airlines added capacity in 2015 despite a weak recovery in demand for air cargo services. The good news for air carriers is that many U.S. companies rely on air transport for high-value goods as a critical part of their supply chain, especially for international imports and exports. So even with depressed demand, certain shipments will always require the expediency only air travel can provide.
Maritime shipping also suffers from an overcapacity problem. Ocean carriers keep buying larger ships to increase their TEU capacity in the face of declining demand trends, and that results in excellent rates for U.S. bulk and container shippers.
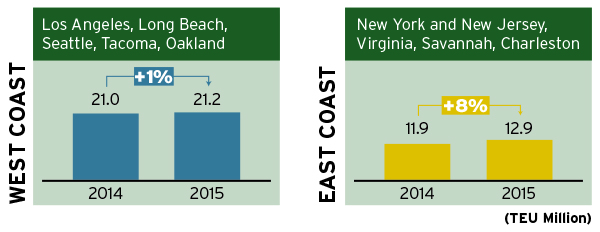
Despite service interruptions in 2015 due to labor problems, California’s Long Beach and Los Angeles ports continue to be the highest-volume container ports in the United States. Whether that will shift with further labor problems and the opening of the widened Panama Canal remains to be seen.
Driving Down the Road
Technological advances, macroeconomic uncertainty, consumer buying trends, and new regulations leave the future of logistics difficult to predict. With so much in flux, CSCMP and Penske Logistics predict four scenarios to begin a dialogue about what can happen moving forward.
- Scenario 1. A technology-friendly environment, complete with regulators who understand the technologies’ limits and possibilities. Driverless vehicles stop the driver shortage. The Internet of Things connects every step of the supply chain to provide maximum efficiency.
- Scenario 2. Operational constraints, the driver shortage, and fuel prices spiral out of control while regulations restrict new technologies that could make things simpler. Only easily implemented technologies succeed, and only in the hands of those who can afford their high cost.
- Scenario 3. Things stay basically the same. Transportation and warehousing technologies are slowly implemented over a long period of time. Facility locations remain central or local to keep costs down.
- Scenario 4. Stringent regulations drive up supply costs, translating to higher consumer costs in a market where competitors are all essentially the same.
The idea behind these four scenarios is not that anything is certain, but to begin a conversation about what each instance would mean for various industries and companies. Supply chain professionals must look at each scenario and plan for what their company would do should that environment, or some form of it, arise in the next decade. Being prepared for all situations can help ensure stability and growth, even in the most uncertain of times.
container traffic at major west & east coast ports
Labor issues at West Coast container ports disrupted service in 2015, drove volumes to other ports, and altered seasonal patterns.
Source: CSCMP’s Annual State of Logistics Report
Do Higher Truckload Rates Drive Better Carrier Performance?
Transportation rates are an ongoing issue for shippers and carriers. Shippers feel pressure to reduce costs while carriers want to be paid fairly.
C.H. Robinson, in conjunction with MIT’s Center for Transportation & Logistics, and TMC, a division of C.H. Robinson, explored the relationship between higher truckload transportation rates per mile and better on-time performance and load tender acceptance from carriers. The research reveals three insights:
- Paying more does not directly result in better on-time pickup (OTP) or on-time delivery (OTD) percentage.The survey finds no significant relationship between OTP and freight rates. And while rates impact OTD more than OTP, the relationship is weak.
There is a meaningful decrease in OTD when shippers pay below market rates. For example, a $50 drop below market rate leads to an OTD performance below 40 percent. A rate of $20 below market results in 40 percent to 70 percent OTD.
- Paying significantly above market price does not provide notable improvements in OTD.The research suggests that there is almost no additional cost to reach the 90+ percent OTD range. Shippers who pay market price have OTD between 70 and 80 percent, and those who charge less have an OTD below 70 percent. A possible hypothesis may be that when faced with more loaded trailers than drivers, carriers might choose the higher-paying load as first priority to assign a driver.
- The survey finds no correlation between acceptance ratios and carrier pricing in a lane.
Carriers increasingly pursue freight consistency. When shippers offer consistent load volumes, the tender acceptance ratios of truckload carriers rise. However, if a shipper is highly inconsistent in a lane over the course of one year, research suggests they will pay up to $170 more per load. Those with highest demand consistency tend to pay a slight premium of $10 per load. A possible reason could be a correlation between very high-volume lanes and available capacity that must be repositioned to meet the demand.
Predictable demand affords carriers greater opportunity to optimize their networks. Third-party logistics (3PL) providers also benefit from predictability, as their carriers are then able to commit volume aligned with their networks. When shippers stay engaged with carriers and 3PLs, their plan has more elasticity and they are able to respond to demand fluctuations. Instead of using a primary carrier and a backup, this research supports using a ratio tendering strategy, which awards loads to a group of carriers.
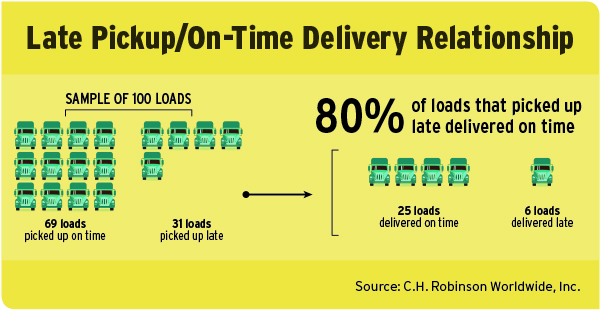
The research also reveals additional on-time performance relationships, though they may not be the relationships you would expect. First, the survey finds that 80 percent of loads that pick up late deliver on time (see chart above). External factors such as weather, traffic, and equipment breakdowns impact the actual time it takes to drive from Point A to Point B.
However, there is often a buffer of time built in between the required pickup and delivery. Carriers use that buffer of time to maximize their Hours of Service (HOS), and some choose to be late at pickup so that they can match the HOS and distance with delivery schedules in order to increase efficiency.
According to the survey, 50 percent of loads delivered late also picked up late. This illustrates that there is still value for shippers and transportation providers to work together to get loads out on time. To identify problem areas, shippers can conduct a lane-level analysis to identify patterns in carrier and location performance, or times of day for pickup and delivery. This may reveal not an extensive issue, but rather a specific problem that the shipper can address to improve performance.
The research also suggests two action items for shippers. First, find the right carrier. Second, monitor performance for on-time delivery. To find the best carrier, look for those whose service and network complements the shipper’s freight. Again, paying market rate produces the best OTD, while paying below market correlates to a drop in OTD, and paying a premium doesn’t provide a significant improvement. To monitor on-time performance, shippers can use a transportation management system to obtain insights for each carrier, and shipping and receiving locations.
— Steve Raetz, Director, Research and Market Intelligence, C.H. Robinson
Logistics Solution Closes the Loop on Aluminum Recycling
Aunique supply chain developed by Ford Motor Company—along with aluminum supplier Novelis and third-party logistics provider Penske Logistics—allows the automaker to recoup some aluminum costs by selling scrap back to its suppliers, and then reusing it.
The cost savings allow Ford to manufacture its new F-150 pickup truck using lightweight aluminum instead of steel for its body panels. The truck is 700 pounds lighter than standard models, and more fuel efficient to meet government requirements.
“This strategy enables Ford to deliver quality, fuel-efficient, and smartly designed vehicles that are affordable to the masses,” says Kelli Felker, manufacturing and labor communications manager at Ford.
Penske crafted a custom logistics solution to provide trucking and logistics service non-stop. The loop starts when Penske Logistics picks up freshly recycled aluminum coil from the Novelis aluminum recycling plant in Oswego, N.Y., and delivers it to Ford’s Dearborn, Mich., stamping plant, which provides parts to build F-150 pickup trucks at Ford’s Dearborn and Kansas City assembly plants. “We build the Super Duty truck in our Louisville plant, and the F-150 pickup in Dearborn and Kansas City,” Felker says.
“Our trucking operation runs 24/7 and we make frequent deliveries around the clock to ensure the continuous flow of aluminum coil and scrap to both Ford and Novelis,” explains Jeff Bullard, senior vice president of operations, central region with Penske Logistics. “The looping process ensures quality control and continuous high-volume production.”
To support the operation, some 200 Penske Logistics drivers live near Ford’s Dearborn stamping plant and the Oswego recycling plant.
This pool of drivers takes turns hauling their loads until they meet at a fixed, centralized point where they swap trucks, return to their respective cities, and go home at night after the shift ends.
“It’s about 430 miles from Oswego to Dearborn, so that relay point allows the driver to get there and back in one day,” say Bullard. “This process also helps with retention, because it provides drivers with a better quality of life.”
Penske Logistics uses electronic logs to track driver hours and comply with Hours of Service regulations. “In the event a driver runs out of hours, we have procedures in place to ensure that the driver takes the required rest break and that the load reaches its intended destination,” explains Bullard.
To provide Ford with the recycled aluminum the automaker needs, Novelis and Penske Logistics developed customized semi-trucks and unique universal trailers that haul both the aluminum coils and the scrap.
“Everything from the truck all the way through to the trailer and its tarping system on top was specifically engineered for this closed-loop recycling program,” Bullard says. “None of it is standard. We have been in production and prototyping since 2012 to build a universal trailer and tarp system that would be applicable to Ford’s operation.”
Meanwhile, the custom equipment that Penske Logistics uses for driving and delivery allows for specialized hauling and heavier loads. “We have roughly 200 trailers and 50 tractors in service,” he adds.
Going Green
Not only does Ford’s recycling program save money, it also ensures a more sustainable supply chain, by putting a lighter and more eco-friendly pickup truck on the road.
As attention to sustainability grows, so does the popularity of aluminum because it is infinitely recyclable, avoids 95 percent of greenhouse gas emissions, and uses less energy and water, according to Automotive Science Group.
“We’ve broken the material up into a 5000 series, which is a magnesium-aluminum-containing alloy, and a 6000 series alloy, which is made of a little more copper,” says Sil Colalancia, director of recycling for Novelis North America. “Ford uses these alloys to make various parts of its vehicles.”
These parts include structural pieces as well as add-on components such as car doors, hoods, cargo beds, roofs, and tailgates.
With a 330-pound weight savings over the 2016 model, the 2017 Super Duty is second only to the F-150 pickup in the amount of aluminum built into a vehicle to date.
“Light weighting is aligned with our sustainability strategy to improve fuel economy and reduce emissions,” Felker says.
The 2015 Ford F-150 truck was the first pickup with a body and cargo bed made of aluminum. Previously, the F-150 was made of steel.
Opting for aluminum over steel in new automobile construction is the best way to reduce energy consumption and carbon emissions, according to Oak Ridge National Lab.
“We saved as much as 700 pounds through the use of advanced materials on the 2015 F-150 compared with the 2014 F-150,” says Felker.
Ford will begin rolling out 2017 Super Duty trucks later in 2016.
“We reinvested additional weight savings everywhere it counts, including in a heavier-duty fully boxed frame, axles, suspension, and towing hardware, as well as stronger components that support better towing and payload capability,” Felker says.
Novelis provides aluminum products for more than 180 vehicle models on the road today. Over the past five years, the aluminum rolling and recycling company has invested more than $400 million in infrastructure improvements in Oswego and is an example of how sustainable manufacturing practices can work well together with excellent supply chain processes.
— Juliette Fairley


