
When P&L Stalls: What Your Freight Metrics Are Telling You
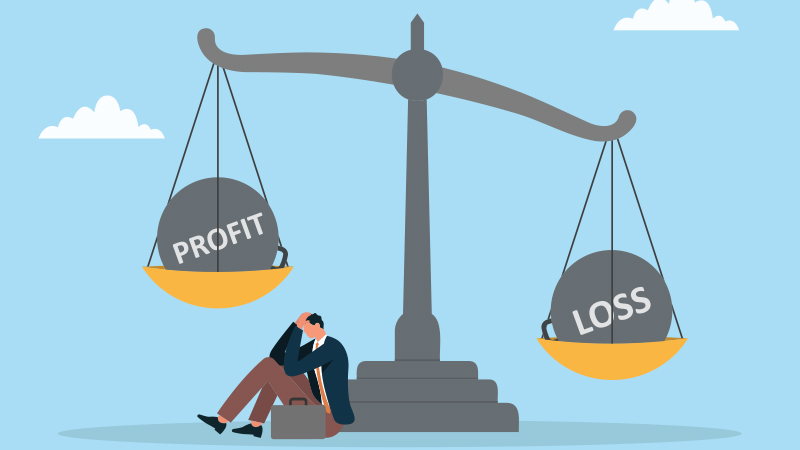

When profitability stalls, freight data often reveals where margin is quietly being lost.
Before launching another sourcing event or investing in new logistics tools, leadership should ask a simple question: Did our freight metrics improve, deteriorate, or remain flat relative to revenue and volume?
For many manufacturers and distributors, transportation is one of the largest variable cost centers in the business, yet it is often one of the least governed. When margins stagnate, leadership typically looks first at pricing, labor, materials, or sourcing. Freight performance may be reviewed, but often only at the surface level, with an emphasis on rates instead of margin impact.
The Freight-P&L Connection
Transportation costs directly affect cost of goods sold, operating expenses, customer profitability, and working capital. Small shifts in freight behavior can create outsized financial consequences.
Flat or declining P&L performance is rarely random. It is often accompanied by subtle changes in freight activity, including rising cost per shipment, freight consuming a larger percentage of revenue, increasing accessorial charges, mode shifts toward expedited or parcel services, and cost variation by customer, channel, or location.
The challenge is that these warning signs are often hidden inside blended averages. Total freight spend may appear stable while cost per order, cost per pound, or cost-to-serve moves in the wrong direction.
Why Freight Metrics Miss the Problem
Most companies track freight through operational dashboards. These tools may show shipment count, carrier performance, transit times, and total spend. While useful, they do not always explain financial outcomes.
Three gaps are common:
- Freight data is disconnected from finance. Transportation data often lives with operations, while margin accountability sits with the CFO. Without a shared framework, freight is treated as a service function instead of a profit lever.
- Volume normalization is missing. Raw spend can be misleading. Growth can hide inefficiency, while lower volume can mask deterioration. Freight performance should be measured against revenue, units shipped, weight, order count, and shipment count.
- Policy-driven behavior goes unmeasured. Free freight thresholds, service commitments, order minimums, routing rules, and expedited approvals all influence cost. When policies are outdated or inconsistently enforced, freight performance can deteriorate even when carrier rates do not change.
Reframing Freight as a Financial Discipline
High-performing organizations review freight metrics alongside financial results. Finance and operations align on definitions, reporting cadence, and accountability. Policies are evaluated for economic impact, not just service outcomes.
If the P&L did not improve last year, there is a strong likelihood freight metrics were moving in the wrong direction. Not because teams were careless, but because the right measurements and governance were not in place.
Freight data is often an early warning system for margin health. The path to P&L improvement begins with understanding what that data has been trying to say.