
Transportation Metrics: How Does Your Carrier Measure Up?

To drive real value, logistics leaders must move beyond tracking endless data points and focus on the few high-impact transportation metrics tied directly to cost and service improvement.
While not all attributes that contribute to a successful organization can be measured, many can. When it comes to transportation and logistics, the volume of metrics and data available can make it challenging to identify the ones likely to provide the greatest value.
“You can chase too many rabbits,” says Lynn Gravley, founder and CEO of NT Logistics.
To be truly useful, data needs to be associated with a lever that can be changed to improve an operation—typically, it’s either cost or service. For example, if a manufacturer learns that its rate of on-time, in-full (OTIF) deliveries to a retail chain falls below an acceptable level, it will need metrics that can pinpoint, among other information, which carriers are arriving late and which facilities are sending shipments that are short inventory.
The greatest insights aren’t necessarily gleaned from more metrics, but from deeper insight into particular ones, says David Nowicki, professor and director, Center for Logistics and Supply Chain Management, University of North Texas.
For example, on-time delivery is usually reported as the percentage of shipments that are on time. However, this alone doesn’t capture the relative severity of late deliveries. An average transit time of 10 hours, with a range of three to 20 hours, represents a wildly different performance than the same 10-hour average with transit times ranging from nine to 11 hours. “Although the average is identical, the second case is far more consistent and predictable,” Nowicki says.
While the most useful metrics vary across organizations, some consistently provide value across different companies. These include:
1. Total Landed Transportation Cost per Unit

By watching this metric, shippers can stay ahead of changes that will eat into profits, Gravley says. Take a company that sells its product for $10 per case, and it costs $1 per case to transport it to a retailer’s distribution center. If the landed transportation cost per case drifts up to $1.20, it eats into the company’s margins.
2. On-time Delivery and Pickup

By monitoring carrier performance and reliability, logistics managers can resolve operational bottlenecks before they disrupt service, helping maintain low customer turnover and strengthen long-term partner relationships.
Today, on-time delivery is considered table stakes. In fact, some companies mandate that suppliers consistently achieve designated OTIF delivery rates, says Kate Ren, Ph.D, assistant professor at Ohio State University. Investments in technology, whether new or classic, such as RFID, can provide greater supply chain visibility to identify bottlenecks and leakage that might cut into OTIF rates.
This metric should also highlight the percentage of packages that not only are delivered on time, but on the first attempt. “A package that takes three attempts and a customer service call isn’t on time, even if it technically beats the promised date on paper,” notes Kyle Henzel, COO of SHIP.com, a shipping intelligence platform.
Along with deliveries, the rate of carrier pickups that occur on time is also key, says Marc Held, chief executive officer of HOPTEK, an AI-native freight monetization service. The reason? A late pickup generally is a failure the carrier owns outright, he adds.
3. Expected Vs. Actual Delivery Times

On-time delivery has become an industry non-negotiable, with many companies mandating strict compliance rates for supplier failures.
Many carriers post expected delivery times. Shippers should also track “expected versus actual” delivery times, says Kenneth Moyer, partner and chief supply chain officer, strategic advisory, with LJM. The consistency between the two numbers is more important than delivery speed alone.
4. Communicate Exceptions
If a package will be late, the carrier should consistently state this before the shipper has to ask and before a customer brings it up. “That second scenario means you’ve already lost,” Henzel says.
5. Safety Records

By tracking carrier safety metrics, shippers can effectively gauge fleet reliability, mitigate risk, and partner with providers that prioritize long-term performance.
“Safety is simultaneously a moral obligation, a cost driver, and a leading indicator of operational discipline everywhere else in the business,” Held says.
For truckers, relevant metrics include the carrier’s record across the seven categories of the FMCSA’s Compliance, Safety, and Accountability (CSA) program:
1. Unsafe driving
2. Crash indicator
3. Hours-of-service compliance
4. Controlled substances and alcohol
5. Hazardous materials compliance
6. Driver fitness
7. Vehicle maintenance
Another key metric is Department of Transportation recordable accidents per million miles. An accident generally is considered recordable if it includes a fatality, including any that don’t occur at the scene; bodily injury that requires transport from the scene for immediate medical treatment; and/or vehicle damage that requires one or more vehicles to be towed from the crash site.
6. Damage, Loss, and Claims Rates
Shippers expect their products to arrive intact. When damage occurs, they want an efficient resolution. So along with the damage rate, it’s important to know how quickly a carrier resolves claims once they’re filed.
“A carrier with a slightly higher damage rate who pays out in five days beats a carrier with a lower damage rate who takes six weeks and three phone calls to get you your money,” Henzel says.
A provider that addresses errors in a timely manner likely has accurate internal data and enough margin to stand behind its service. Conversely, a carrier that fights everything is usually short of one or both, Held adds.
7. Financial Health
A carrier that’s financially healthy will be better positioned to maintain its fleet and attract drivers.
One indication of financial health is how long a carrier takes to pay its owner-operators. While few carriers publicize this, some shippers simply ask during onboarding, Henzel says.
Shippers can also uncover clues in other ways. Carrier vetting or credit-monitoring services often track payment history. A carrier that leans on quick-pay factoring companies might be running short on cash. “The information is out there, but a shipper usually has to look for it,” Henzel adds.
8. Continuous Improvement Numbers
By themselves, descriptions of continuous improvement initiatives don’t really tell how they help a transportation provider or its customers. When a carrier says it has a continuous improvement program, Held recommends asking for several years of metrics, such as cost per mile, empty miles, and time to onboard. These will help show the program’s value.
9. Billing Accuracy and Transparency
If a carrier’s freight invoices regularly contain errors, that’s a quality issue even if the delivery performance is fine, Henzel says. Billing errors, including small ones, gradually add up.
The importance of rate and surcharge transparency will keep climbing, given recent rapid and unpredictable movements in fuel surcharges. “Shippers are done with surprises on their invoices,” Henzel adds.
10. Customer Retention Rate
A solid customer retention rate shows that a provider offers long-term value, says Randy Ofiara, senior vice president of managed logistics performance with Blue Grace Logistics.
A significant customer turnover rate warrants investigation. Among the issues to check are the company’s account management strategy and its approach to staffing and training. Most leading companies have low customer turnover and a solid management structure to help drive value for their clients.
11. Equipment Quality and Availability
The average cost to operate a truck was $2.336 per mile in 2025, the highest recorded, according to the American Transportation Research Institute (ATRI). Similarly, repair and maintenance costs jumped 8.6%.
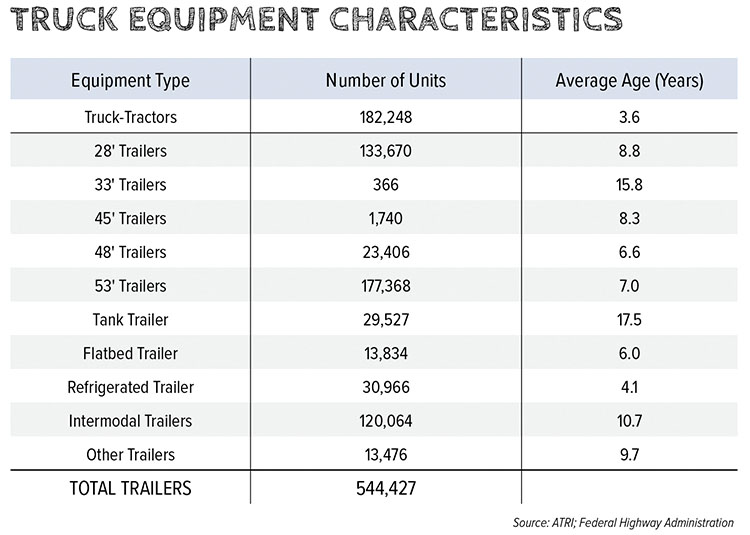
In 2025, the average truck age rose to 3.6 years for the first time since 2022, though it remains historically low due to delayed deliveries from the post-pandemic boom. Meanwhile, average trailer ages dropped because fleets operated fewer trailers and retired older units sooner.
Yet, truckload and refrigerated operating margins stayed below 1%. So, some carriers continued to use older trucks and delayed equipment purchases, the ATRI said (see chart, above).
“When margins are that thin, some operators defer repairs they shouldn’t,” Held says. These decisions can eventually impact a fleet’s reliability.
To judge equipment quality, shippers can look at a fleet’s age, the carrier’s maintenance program, and its roadside out-of-service rate, among other metrics.
A Closer Look at Underrated Metrics
Some metrics haven’t quite captured the same level of attention as, for instance, on-time delivery, but they also provide important clues to carriers’ operations. These metrics include:
- Workforce stability. Driver turnover is the most underrated number in trucking. “A carrier at 100% turnover is the equivalent of running a training company that happens to move freight,” Held says. Ultimately, the high turnover will impact service.
- Decision latency. While many shippers measure whether a tender was accepted, few measure how long they waited for the answer, Held says. Two carriers can post identical acceptance rates, yet one answers in seconds and the other in hours. Carriers should indicate the share of tenders they decide by policy within seconds, as well as their exception rate.
- Rejection reason codes. Shippers should understand why a carrier didn’t take a load, whether it was capacity, price, timing, or some other factor. Structured reasons tend to mean a system with a policy in place, Held says.
- Accepted and then rejected. Because carriers typically accept loads based on planned capacity, an unanticipated mechanical or driver issue can mean an accepted load later gets bounced. Other times, a load might be rejected because a better-paying one came along. “Both look identical on a scorecard, so watch the pattern,” Held says. Random fall-offs suggest capacity changes, while fall-offs that cluster in tight markets and hot lanes could mean the carrier is prioritizing other loads.
- The use of subcontracted carriers. A carrier that runs its own trucks and drivers has more control over its ability to actually cover a load, Henzel says. A carrier that often subcontracts shipments to other carriers has more flexibility, but also less certainty. Moreover, the freight ends up a step or two removed from the company the shipper thought it hired. Shippers should know the percentage of shipments the provider moves with its own equipment.
Emerging Metrics
The set of transportation metrics continues to expand. More logistics managers are focusing on factors such as sustainability, volatility, and return on investment. Productivity may garner more interest over the next decade as well.
“With the adoption of AI and other breakthrough technologies, we could see an increase in logistics productivity and throughput at warehouses and DCs,” Ren says. Logistics metrics growing in use include:
Sustainability. Because more consumers are environmentally conscious, they’ll often notice—not favorably—packages with a great deal of wasted space or packing peanuts, Moyer says. That said, many organizations tend to focus on actions, such as optimizing package sizes, that can reduce both cost and the impact on the environment.
When measuring emissions, empty miles is the most honest proxy. It’s harder to massage than a carbon figure, and it impacts both cost and driver retention. “Density is the rare metric where the sustainability answer and the economic answer are identical,” Held says.
While carriers generally don’t publish empty miles, shippers can check industry averages. They also can watch how carriers price specific lanes, or whether they generally want a backhaul on certain routes.
The Delivery Experience. The perceived delivery experience is becoming an increasingly important aspect of online shopping, Moyer says. While this is generally more subjective than, say, on-time delivery rates, several measurements can help shippers measure the experience.
One is the percentage of deliveries made by uniformed rather than non-uniformed personnel. Many customers view a uniformed delivery person as more professional.
A second could be customer complaints per 100 deliveries, focusing on issues that are within the carrier’s responsibility, such as a delivery person throwing a package or failing to follow delivery instructions.
Depth Over Volume
Key metrics reveal a carrier’s true operational performance, while underrated variables such as decision latency and empty-mile sustainability offer deeper insights into long-term resilience.
Ultimately, prioritizing metric depth over volume ensures shippers build predictable and cost-effective transportation networks.
Leveraging Metrics
Shippers can get more from the metrics they use by keeping in mind a few guidelines.
One is to remain connected with both their logistics providers and carriers, even when they’ve outsourced their transportation management function. This includes participating in performance reviews. “Carriers behave differently when they know the shipper is in the room,” says Marc Held, CEO of HOPTEK.
It’s also important to stick with the metrics for the long haul. When a new carrier is introduced, the tracking often is very stringent. Over time, however, the commitment to tracking tends to fade and standards aren’t as rigorously enforced. This can lead to drops in service levels.
Along with measuring their transportation providers, shippers benefit by monitoring their own actions. For instance, some shippers will regularly order one-third of a truck on Monday, another third on Wednesday, and yet another on Friday, rather than ordering one full truck each week, even when it’s feasible. Reviewing order minimums and frequencies can boost discipline and cut costs.
Moreover, shippers can impact a carrier’s service with their own missteps, such as late tendering or unrealistic transit expectations.
“The shippers who get the best service aren’t the ones with the toughest scorecards,” Held says. “They’re the ones who measure themselves on the same axis.”