What’s New in Warehouse Automation; Global Logistics Connections Strengthen; Port Container Volumes Rise; and More Logistics & Supply Chain News

Logistics and supply chain news and highlights shaping the future of global logistics.
Warehouse Automation Trends
2025 was a tale of two halves for the warehouse automation market: thanks to tariff uncertainty in the beginning of the year, many companies postponed large capital expenditure projects. Toward the end of the year, however, uncertainty declined more quickly than anticipated, and warehouse automation order intake for 2025 ultimately grew by 7%, exceeding expectations, according to findings from Interact Analysis.
Interact Analysis’ new research reveals other interesting warehouse automation trends to watch, including:
Nominal Growth vs. Real Volume: Market order intake grew by 7% year-on-year, but this was heavily influenced by rising input costs. Higher steel and aluminum tariffs (25%) pushed up system prices, meaning revenue growth was partly due to inflation rather than just increased project volume.
The “Great Divide” in Vendor Performance: Growth was extremely concentrated. Large vendors with ties to major “behemoths” saw massive gains, while those focused on SMEs struggled.
High Performers: Toyota Industries (+65%), TGW (+55%), and Dematic (+50%) reported significant order intake growth through Q3 2025.
Underperformers: AutoStore, typically associated with mid-sized projects, saw a 5% decline in order intake during the same period.
Mobile Robot Resilience: Despite the wider market slowdown, mobile robot vendors like Geek+ outperformed the trend, reporting 30% growth in the first half of 2025. However, the segment remains volatile, with some vendors, including EK Robotics, facing financial stress and bankruptcy.
2026 Outlook Shows Broad-Based Recovery: Expect a more balanced market in 2026. As uncertainty eases and vacancy rates decline, a growing share of investment is expected to return from small and mid-sized enterprises.
Globalization’s Staying Power

Despite escalating geopolitical tensions and ongoing uncertainty around U.S. tariffs and future trade policies, globalization remains at a historically high level. This is one of the key findings from the DHL Global Connectedness Report 2026, newly released by DHL and New York University’s Stern School of Business. Global connectedness reached a record high in 2022 and has not changed appreciably through 2025, notes the report, which also indicates that trade ties between the United States and China—the world’s two largest economies—continue to weaken.
This year’s index ranks the United States 39th out of 180 economies, having fallen nine places since 2019. The United States’ overall score, measuring its absolute level of connectedness, declined 0.9 points over the past five years (on a scale from 0 to 100). Since 2023, the United States’ rank rose one place and its score fell 0.3 points.
Here are 10 key takeaways from the report:
Global connectedness remains stable. The Index does not indicate a shift from international to domestic activity across trade, capital, information, and people flows.
Goods trade grew faster in 2025 than in any year since 2017, excluding the pandemic period.
Trade growth is forecast to continue over the 2026-2029 period at the same average pace as during the past decade.
U.S.–China ties continue to diminish. Since 2016, the share of U.S. trade, capital, information, and people flows with China has dropped 42%, while China’s share with the United States is down 37%.
The share of U.S. imports coming directly from China has fallen from a peak of 22% in 2017 to 13% in 2024, before plummeting farther to only 9% during the first three quarters of 2025.
The world remains far from a split into disconnected geopolitical blocs. Only 4-6% of global goods trade, greenfield foreign direct investment (FDI), and cross-border M&A have shifted away from geopolitical rivals over the past decade.
Most international business already occurs among friendly countries, limiting the threat de-risking strategies pose to globalization.
Goods trade and greenfield FDI crossed their longest average distances on record in 2025, while the shares of these flows occurring within major geographic regions fell to new lows.
Singapore is the world’s most globally connected country, followed by Luxembourg and the Netherlands. Singapore has the largest international flows relative to domestic activity, and the United Kingdom has the most broadly distributed flows around the world.
Prominent narratives about deglobalization are driven more by politics and public policy than by actual shifts in cross-border flows.

Ports Best Stormy Seas
North American port activity reached a new high in 2025, but not without fighting through one of the most volatile years in recent memory. Container volumes rose 1.6% to 62.3 million TEUs across the top 15 ports last year, surpassing the 2022 peak and setting a record, according to the Savills Ports Report, presented by Savills Industrial Services.
The dramatic year included shippers front-loading cargo ahead of shifting tariff deadlines, then endured sharply falling volumes when a 145% stacked tariff on China in April 2025 effectively curtailed trade, before rebounding once that tariff was lifted. Savills import volatility index reached 8.1% from May through July, double the 10-year average and a level last seen in 2020.
Additional trends include:
Continued dominance from Asia-Pacific hubs, where the five largest ports account for more than one-third of global container throughput.
11 of the 15 major ports posted year-over-year gains. Baltimore saw the largest percentage increase as it recovered from its 2024 bridge collapse, while the Port of Virginia experienced the steepest decline in volume.
Rising strategic investment in port infrastructure worldwide, with upgrades aimed at improving capacity, resilience, and efficiency.
Ports remained relatively stable with no major labor strikes and improved hiring conditions, though future immigration policy may tighten the labor pool again.
Looking ahead for the remainder of 2026, the report forecasts that port activity will flatten or ease slightly as the effects of tariff front-loading fade and more sophisticated inventory analytics help smooth out import cycles.
What’s Driving SC Innovation?
As companies continue to persevere through today’s complex supply chain operating environment, innovation plays a starring role. New innovations and technologies are key to helping companies thrive in the face of persistent economic and workforce pressures.
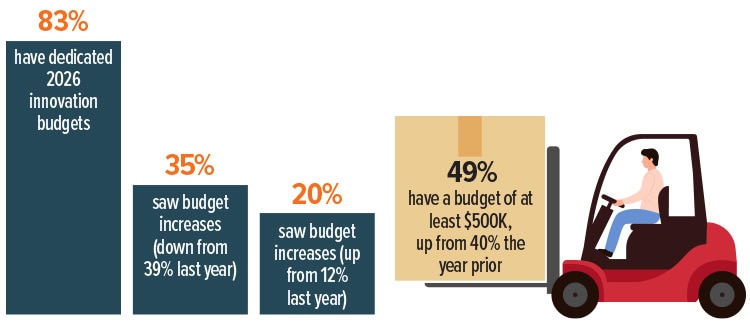
Taking a deep dive into what’s fueling the quest for innovation, Kenco’s 2026 Innovation Report shows that inflation rises to the top. Nearly half of respondents (45%) cite inflation as their primary innovation driver, followed by labor shortages (28%), and sustainability priorities (27%). At the same time, organizations face significant hurdles in turning new ideas into reality. The report cites cost constraints (51%), workforce challenges (45%), and technology integration issues (29%) as the biggest barriers to innovation progress, underscoring the complexity of implementing new tools across existing operations.
Despite financial constraints, companies are still devoting resources to innovation, with 35% of respondents even reporting increased innovation budgets. Nearly half of respondents cite a budget of at least $500,000, up from 40% the year prior. (See chart below.)
Which innovations generate the most buzz? The Kenco data shows the top supply chain innovations being added in 2026 are AI & machine learning (27%), computer vision (23%), supply chain digitization (18%), and generative AI (17%).
 The survey also reveals internal friction around innovation initiatives. Operations is cited as the most difficult department to collaborate with (40%), followed by IT (33%) and HR (23%), highlighting the organizational alignment challenges that often accompany transformation efforts.
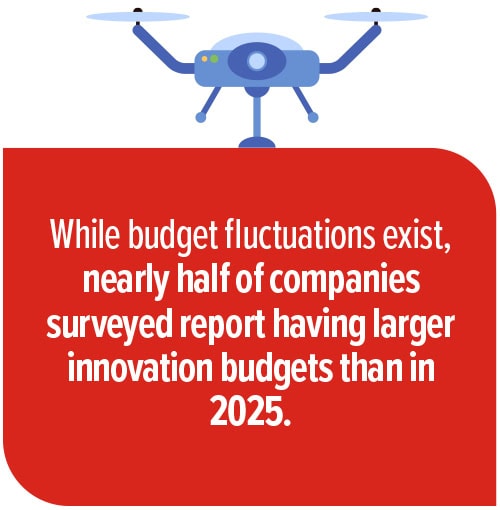
Despite Caution, Budget Growth Continues
Even with financial strain, most companies still find room in the budget for innovation, though they’re more cautious than they were heading into 2025.